Auroracast
Going to school in the North meant that we would get occasional glimpses at the Northern Lights. However, I always struggled to be able to quickly parse through the reports to tell if I would be able to see them - I didn’t want to have to remember my longtitude and latitude, figure out the Kp index at my location, and have to check for cloud coverage.
Instead, using Darksky API and aurora tabular reports from the NOAA, I created a better visual indicator for visibility.
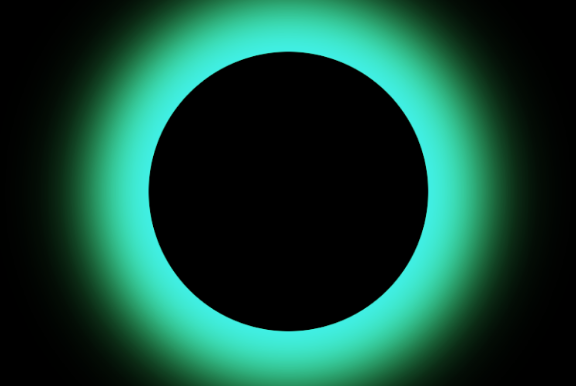
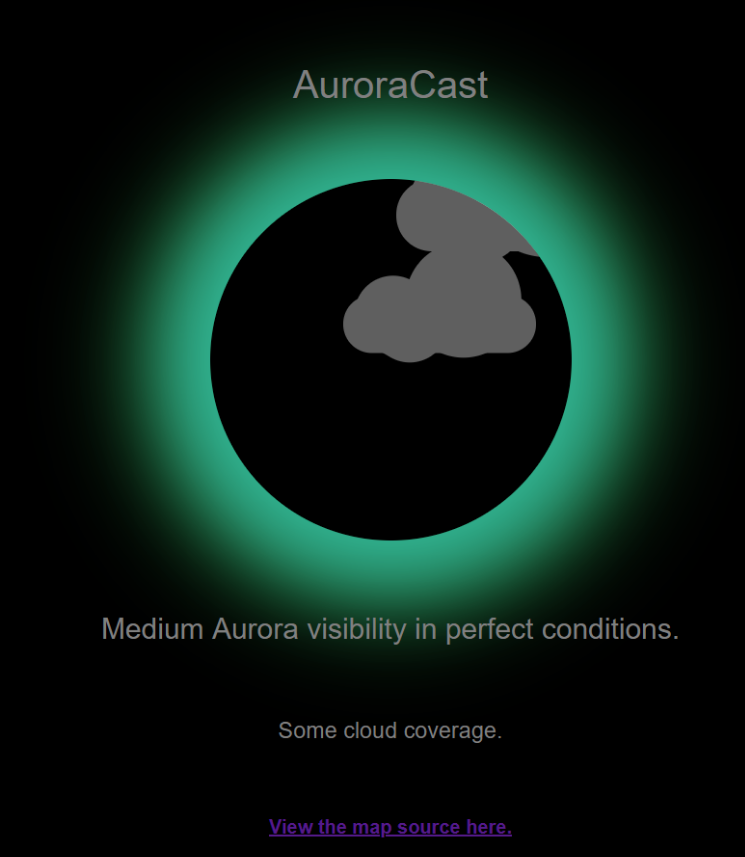
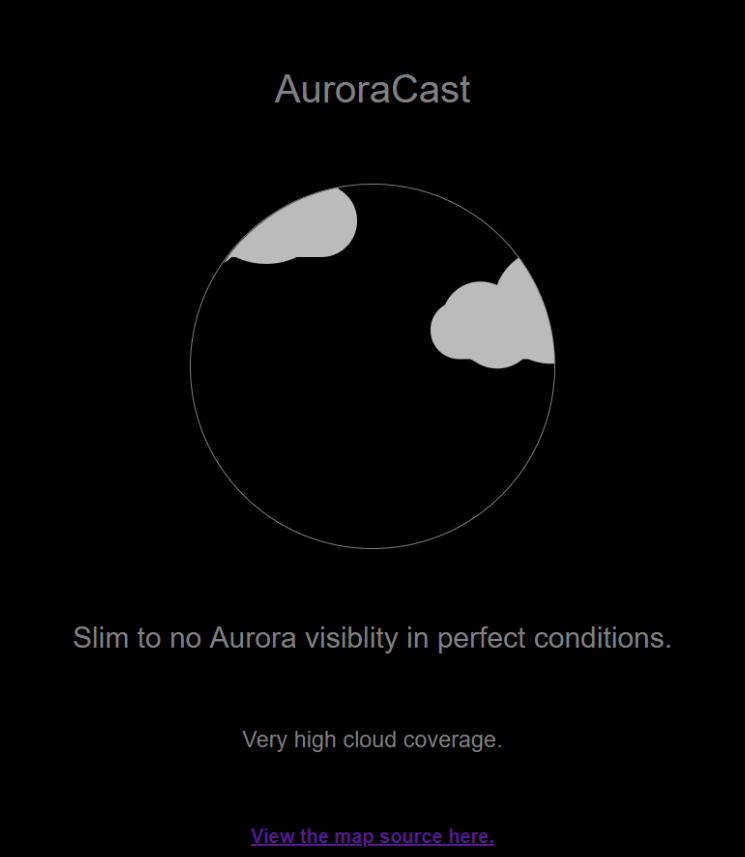
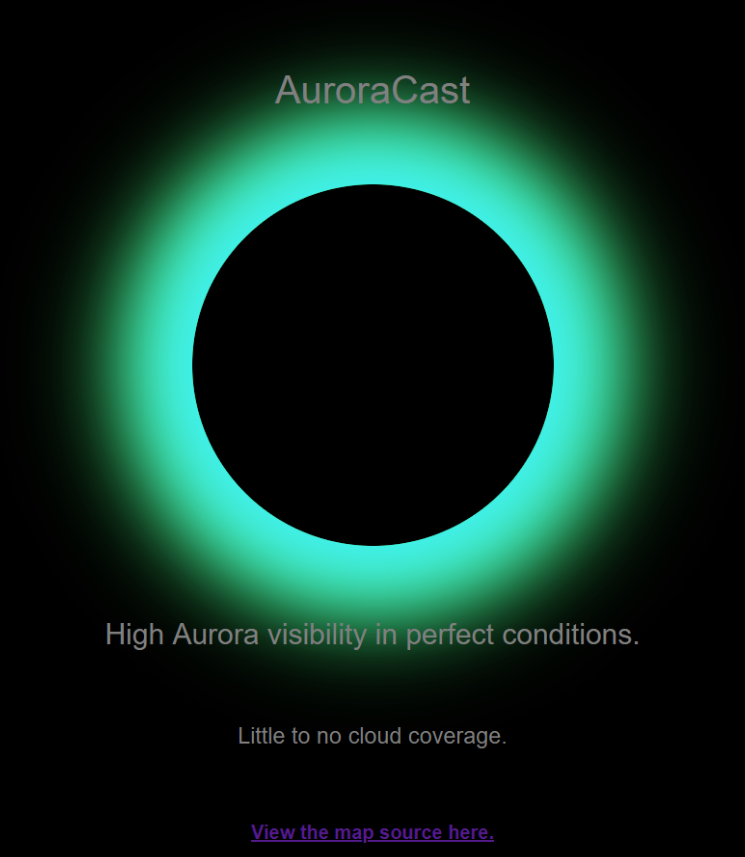
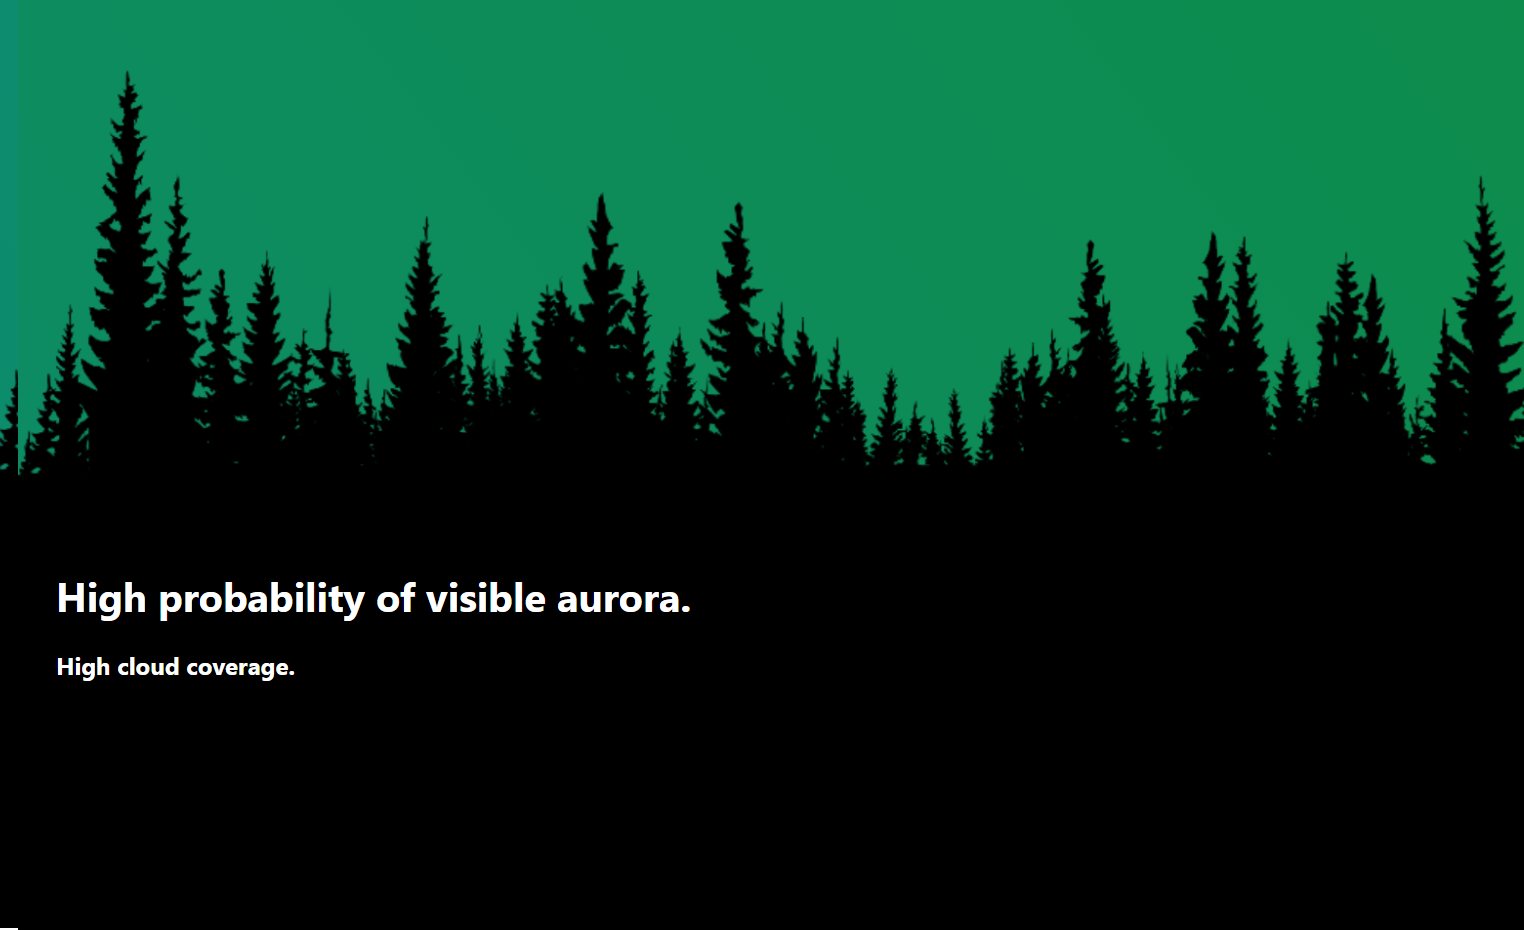
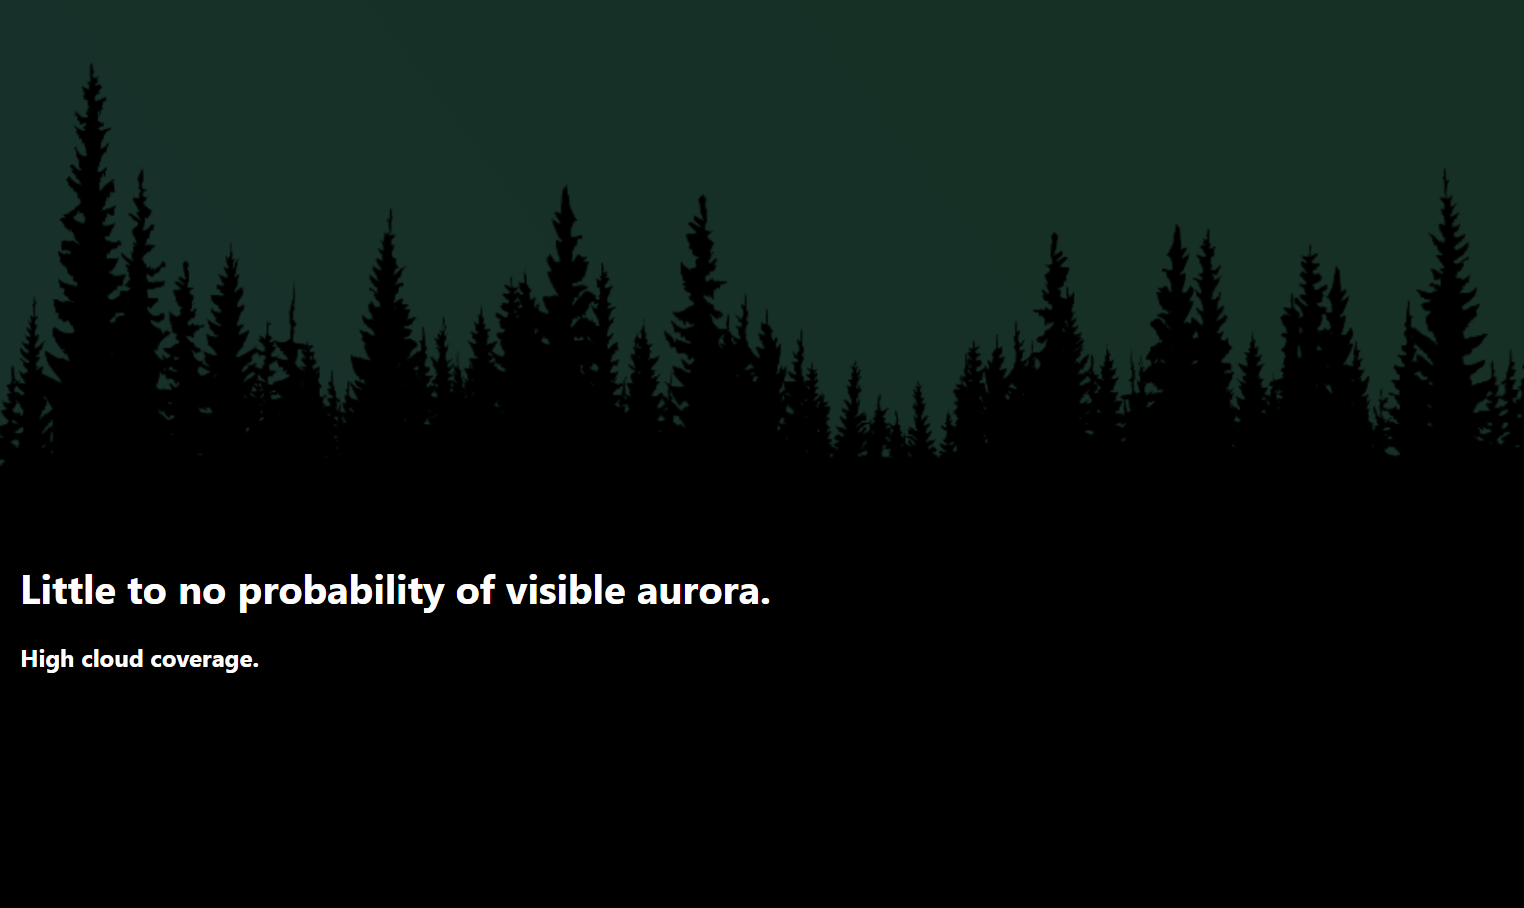
The cloud animation grows in opacity with real location cloud coverage. The glow on the circle represents the Kp index, or the measure of magnetic field disruptance caused by solar wind. Here are a couple of the different views:
It is built with HTML, CSS, and Javascript. The repository can be found here.
As a exercise later on, I wanted to create an alternate layout for the information:
Additional information and code can be found on the Github repository.